Measure statistical significance in difference between means.
t-test: 2 categories
ANOVA (analysis of variance): 3 or more categories.
Unlike Pearson r, they do not measure correlation.
Measure if the differences in observations is statistically significant.
ANOVA: indicates difference but not which one.
Example: Test scores
import pandas as pdimport numpy as npraces = ['white', 'African American', 'Latino', 'other']weights = [0.6, 0.2, 0.15, 0.05]income = ['0-25k', '26-75k', '75-150k' ]student = [i for i inrange(100)]score = [i for i in np.random.normal(0.75, 0.1, 100 )]race = [i for i in np.random.choice(races, size=100, p=weights)]gender = [i for i in np.random.choice(['male', 'female'], size=100)]income = [i for i in np.random.choice([1,2,3,4], size=100, p=[0.15, 0.35, 0.35, 0.15])]class_size = [i for i in np.random.randint(12, 35, size=100)]df = pd.DataFrame({'student': student, 'score': score, 'race': race, 'gender': gender, 'income': income, 'class_size': class_size})df.head()
student
score
race
gender
income
class_size
0
0
0.741935
white
male
3
30
1
1
0.661050
white
male
3
14
2
2
0.612723
white
female
3
32
3
3
0.729796
white
female
2
32
4
4
0.835688
African American
male
2
19
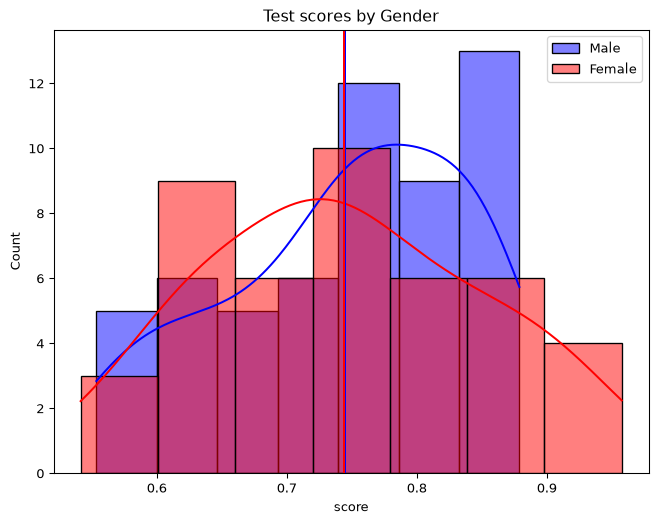
Example: Test scores, cont.
import matplotlib.pyplot as pltimport seaborn as snsplt.figure(figsize=(8, 6))men = df.loc[df["gender"] =="male"]women = df.loc[df["gender"] =="female"]sns.histplot(data=men, x="score", color="blue", label="Male", kde=True)sns.histplot( data=women, x="score", color="red", label="Female", kde=True,)plt.axvline(men["score"].mean(), c="b")plt.axvline(women["score"].mean(), c="r")plt.title("Test scores by Gender")plt.legend()plt.show()
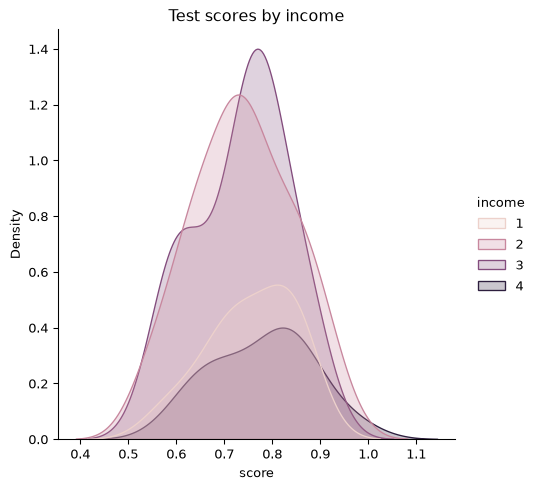
Test Scores by income
ax = sns.displot(data=df, x='score', hue='income', kind='kde', fill=True)plt.title('Test scores by income')
Text(0.5, 1.0, 'Test scores by income')
t-test output
measure between 2 categories
t-stat: -infinity to infinity
positive result: first group has greater mean
negative result: second group had greater mean
p-value: significance (0.05).
Finding Critical t
degrees of freedom
observations in 1st group (n1)
observations in 2nd group (n2)
df = n1 + n2 -2
alpha = significance value (0.05)
critical t = stats.t.ppf(1-alpha/2, df)
ANOVA output
F-value: 0 to infinity
positive output
p-value: significance (0.05)
Finding the Critical F
Critical F: value over which indicates significance.
Degrees of freedom between (dfb): categories - 1
Degrees of freedom within (dfw): observations - categories.
alpha: (significance standard, for us 0.05)
critical f = stats.f.ppf(1- alpha, dfb, dfw)
outputs the threshold the f-value must surpass.
Let’s get the t-test from our test data
import scipy.stats as statsmen = df.loc[df['gender']=='male', 'score']women = df.loc[df['gender']=='female', 'score']result = stats.ttest_ind(men, women)t,p = resultd = result.df# result.df = attribute, not part of tuple# cannot be deconstructed.print(f't: {t}, p: {p}, df: {d}')
import scipy.stats as statsprint("unique values list: ", df["income"].unique())i1, i2, i3, i4 = [df.loc[df["income"] == i, "score"] for i in df["income"].unique()]f, p = stats.f_oneway(i1, i2, i3, i4)print(f"f: {f}, p: {p}")