| student | score | race | gender | income | class_size | |
|---|---|---|---|---|---|---|
| 0 | 0 | 0.801910 | white | female | 2 | 29 |
| 1 | 1 | 0.731556 | white | male | 2 | 18 |
| 2 | 2 | 0.812534 | white | male | 3 | 19 |
| 3 | 3 | 0.829196 | African American | female | 3 | 18 |
| 4 | 4 | 0.706976 | white | female | 3 | 14 |
Cat2Num Stats
Bivariate Category to Numeric Statistics
t-tests & ANOVAs
- Measure statistical significance in difference between means.
- t-test: 2 categories
- ANOVA (analysis of variance): 3 or more categories.
- Unlike Pearson r, they do not measure correlation.
- Measure if the differences in observations is statistically significant.
- ANOVA: indicates difference but not which one.
Example: Test scores
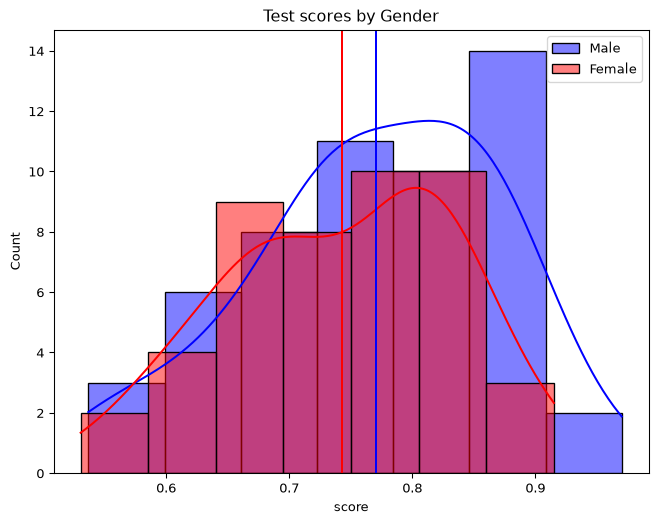
Example: Test scores, cont.
Test Scores by income
Text(0.5, 1.0, 'Test scores by income')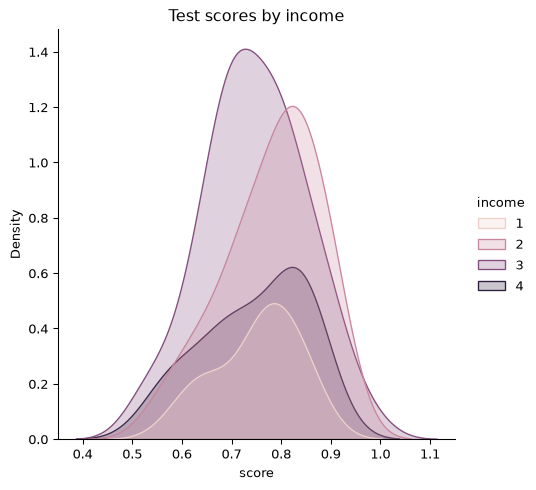
t-test output
- measure between 2 categories
- t-stat: -infinity to infinity
- positive result: first group has greater mean
- negative result: second group had greater mean
- p-value: significance (0.05).
Finding Critical t
- degrees of freedom
- observations in 1st group (n1)
- observations in 2nd group (n2)
- df = n1 + n2 -2
- alpha = significance value (0.05)
- critical t =
stats.t.ppf(1-alpha/2, df)
ANOVA output
- F-value: 0 to infinity
- positive output
- p-value: significance (0.05)
Finding the Critical F
- Critical F: value over which indicates significance.
- Degrees of freedom between (dfb): categories - 1
- Degrees of freedom within (dfw): observations - categories.
- alpha: (significance standard, for us 0.05)
- critical f =
stats.f.ppf(1- alpha, dfb, dfw) - outputs the threshold the f-value must surpass.
Let’s get the t-test from our test data
import scipy.stats as stats
men = df.loc[df['gender']=='male', 'score']
women = df.loc[df['gender']=='female', 'score']
result = stats.ttest_ind(men, women)
t,p = result
d = result.df
# result.df = attribute, not part of tuple
# cannot be deconstructed.
print(f't: {t}, p: {p}, df: {d}')
t: 1.4297999623739412, p: 0.15595477287689072, df: 98.0Example: t-test, cont.
Does it surpass critical t
ANOVA Example
import scipy.stats as stats

i1 = df.loc[df["income"] == 1, "score"]
i2 = df.loc[df["income"] == 2, "score"]
i3 = df.loc[df["income"] == 3, "score"]
i4 = df.loc[df["income"] == 4, "score"]
f_return = stats.f_oneway(i1, i2, i3, i4)
print(f_return)
F_onewayResult(statistic=np.float64(0.836703537922017), pvalue=np.float64(0.4769781774837194))ANOVA Example, faster
import scipy.stats as stats

print("unique values list: ", df["income"].unique())
i1, i2, i3, i4 = [df.loc[df["income"] == i, "score"] for i in df["income"].unique()]
f, p = stats.f_oneway(i1, i2, i3, i4)
print(f"f: {f}, p: {p}")
unique values list: [2 3 4 1]
f: 0.8367035379220169, p: 0.4769781774837193