Univariate Statistics
- Measure distribution of a single variable
- 4 types of measures:
- Central Tendency
- Dispersion
- Distribution Shape
- Graphical Representation
Central Tendencies
- Mean: Average of all values
- Median: Middle values when sorted
- Mode: Most frequent value
Dispersion
- Range: Difference between max and min
- Variance: Average of squared differences from mean
- Standard Deviation: Square root of variance
Variance
\[ s^2 = \frac{\sum_{i=1}^{n} (x_i - \bar{x})^2}{n-1} \]
- \(s^2\) is the sample variance
- \(n\) is the number of observations in the sample
- \(x_i\) is the \(i\)th observation in the sample
- \(\bar{x}\) is the sample mean
Variance Use
- Variance is used to measure how spread out the values in a data set are
- A high variance indicates that the data points are very spread out from the mean
Standard Deviation
\[ s = \sqrt{\frac{\sum_{i=1}^{n} (x_i - \bar{x})^2}{n-1}} \]
- \(s\) is the sample standard deviation
- \(n\) is the number of observations in the sample
- \(x_i\) is the \(i\)th observation in the sample
- \(\bar{x}\) is the sample mean
Standard Deviation Use
- Turns variance into a more understandable metric
- Standard deviation explains how much the data deviates from the mean
- Each standard deviation away from the mean accounts for a certain percentage of the data
Distribution Shape
- Skewness: Measure of symmetry in data
- Kurtosis: Measure of the “tailedness” of the data
![]()
Figure 1
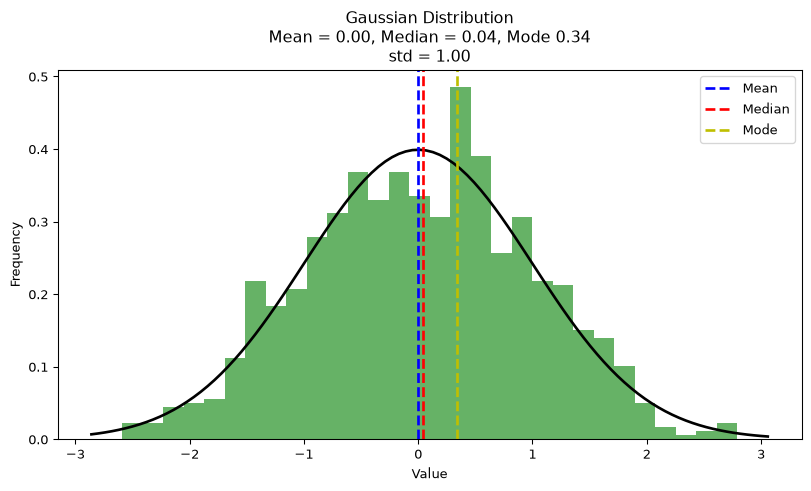
Skewness: Normal, Gaussian, Bell Curve
- 68% of data falls within 1 standard deviation
- 95% of data falls within 2 standard deviations
- 99.7% of data falls within 3 standard deviations
- Mean = Median = Mode
Skewness: Positive/Negative
- Positive Skewness: Tail is farther on the larger side of the x-axis
- Negative Skewness: Tail is farther on the smaller side of the x-axis
![]()
Skewness Representation
Kurtosis
- Measure of the “tailedness” of the data
- The more the Kurtosis, the more the data is in the tails
- Normal Distribution has a Kurtosis of 3
- Higher Kurtosis: More data in the tails
- Lower Kurtosis: Less data in the tails
- Measures how many outliers.