Geo-Spatial Analysis, Part II

Data Literacy

Geospatial Analysis

  • Recap:
    • All Data is summary.
    • All Data is biased.
  • If we do Data right, it will not obscure what we are looking for.

Geo-Spatial Analysis

  • Now let’s learn what we can do with space and place.

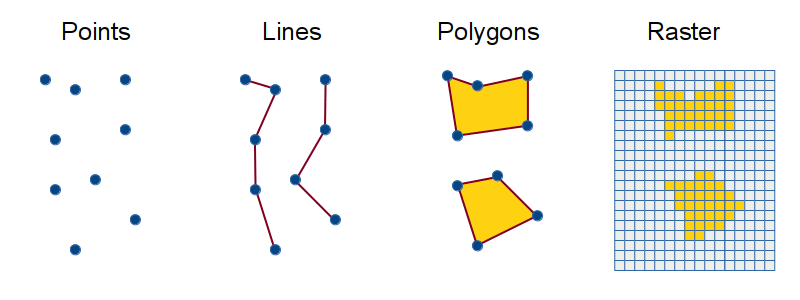
Simple Geography Types

  • Feature: One entity on the map.
  • Point
    • A single point in space. (long, lat): (0,0)
  • Line
    • A connected sequence of points. [(long, lat), (long, lat)]: [(0.0), (0,1), (1,1)]
  • Polygon
    • A closed shape defined by a sequence of points. [(long, lat), (long, lat), (long, lat)]: [(0,0), (0,1), (1,1), (1,0)]

Examples

import geopandas as gpd
from shapely.geometry import Point, LineString, Polygon
import matplotlib.pyplot as plt

plt.figure(figsize=(10, 8))

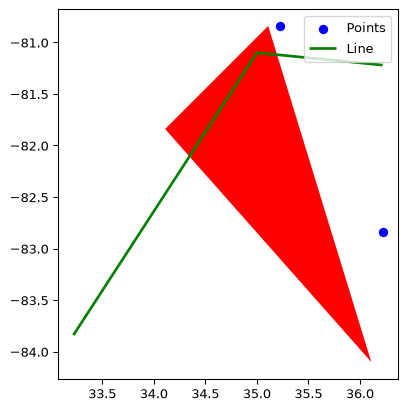
points = [Point(35.22, -80.84), Point(34.22, -81.84), Point(36.22, -82.84)]
line = LineString([(33.22, -83.84), (35.00, -81.1), (36.22, -81.22)])
polygon = Polygon([(35.11, -80.84), (34.11, -81.84), (36.11, -84.1)])

gdf_points = gpd.GeoDataFrame(geometry=points)
gdf_line = gpd.GeoDataFrame(geometry=[line])
gdf_polygon = gpd.GeoDataFrame(geometry=[polygon])
ax = gdf_points.plot(color="blue", marker="o", label="Points")
gdf_line.plot(ax=ax, color="green", linewidth=2, label="Line")
gdf_polygon.plot(ax=ax, color="red", linewidth=2)
ax.legend()
plt.show()
<Figure size 960x768 with 0 Axes>

Examples cont.

Complex Geography Types

  • Multi-points
    • Many points that combine to create one feature
  • Multi-Lines
    • Multiple lines that combine to create one feature
  • Multi-Polygons
    • Multiple Polygons that combine to create one feature.

Examples, cont.

How can we use these to make sense of data.

  • We can assign data to these features.
  • Three main files:
    • Shape File (.shp) (created by ESRI)
    • GeoJSON (.json / .geojson) (for the Web)
    • CSV (csv)
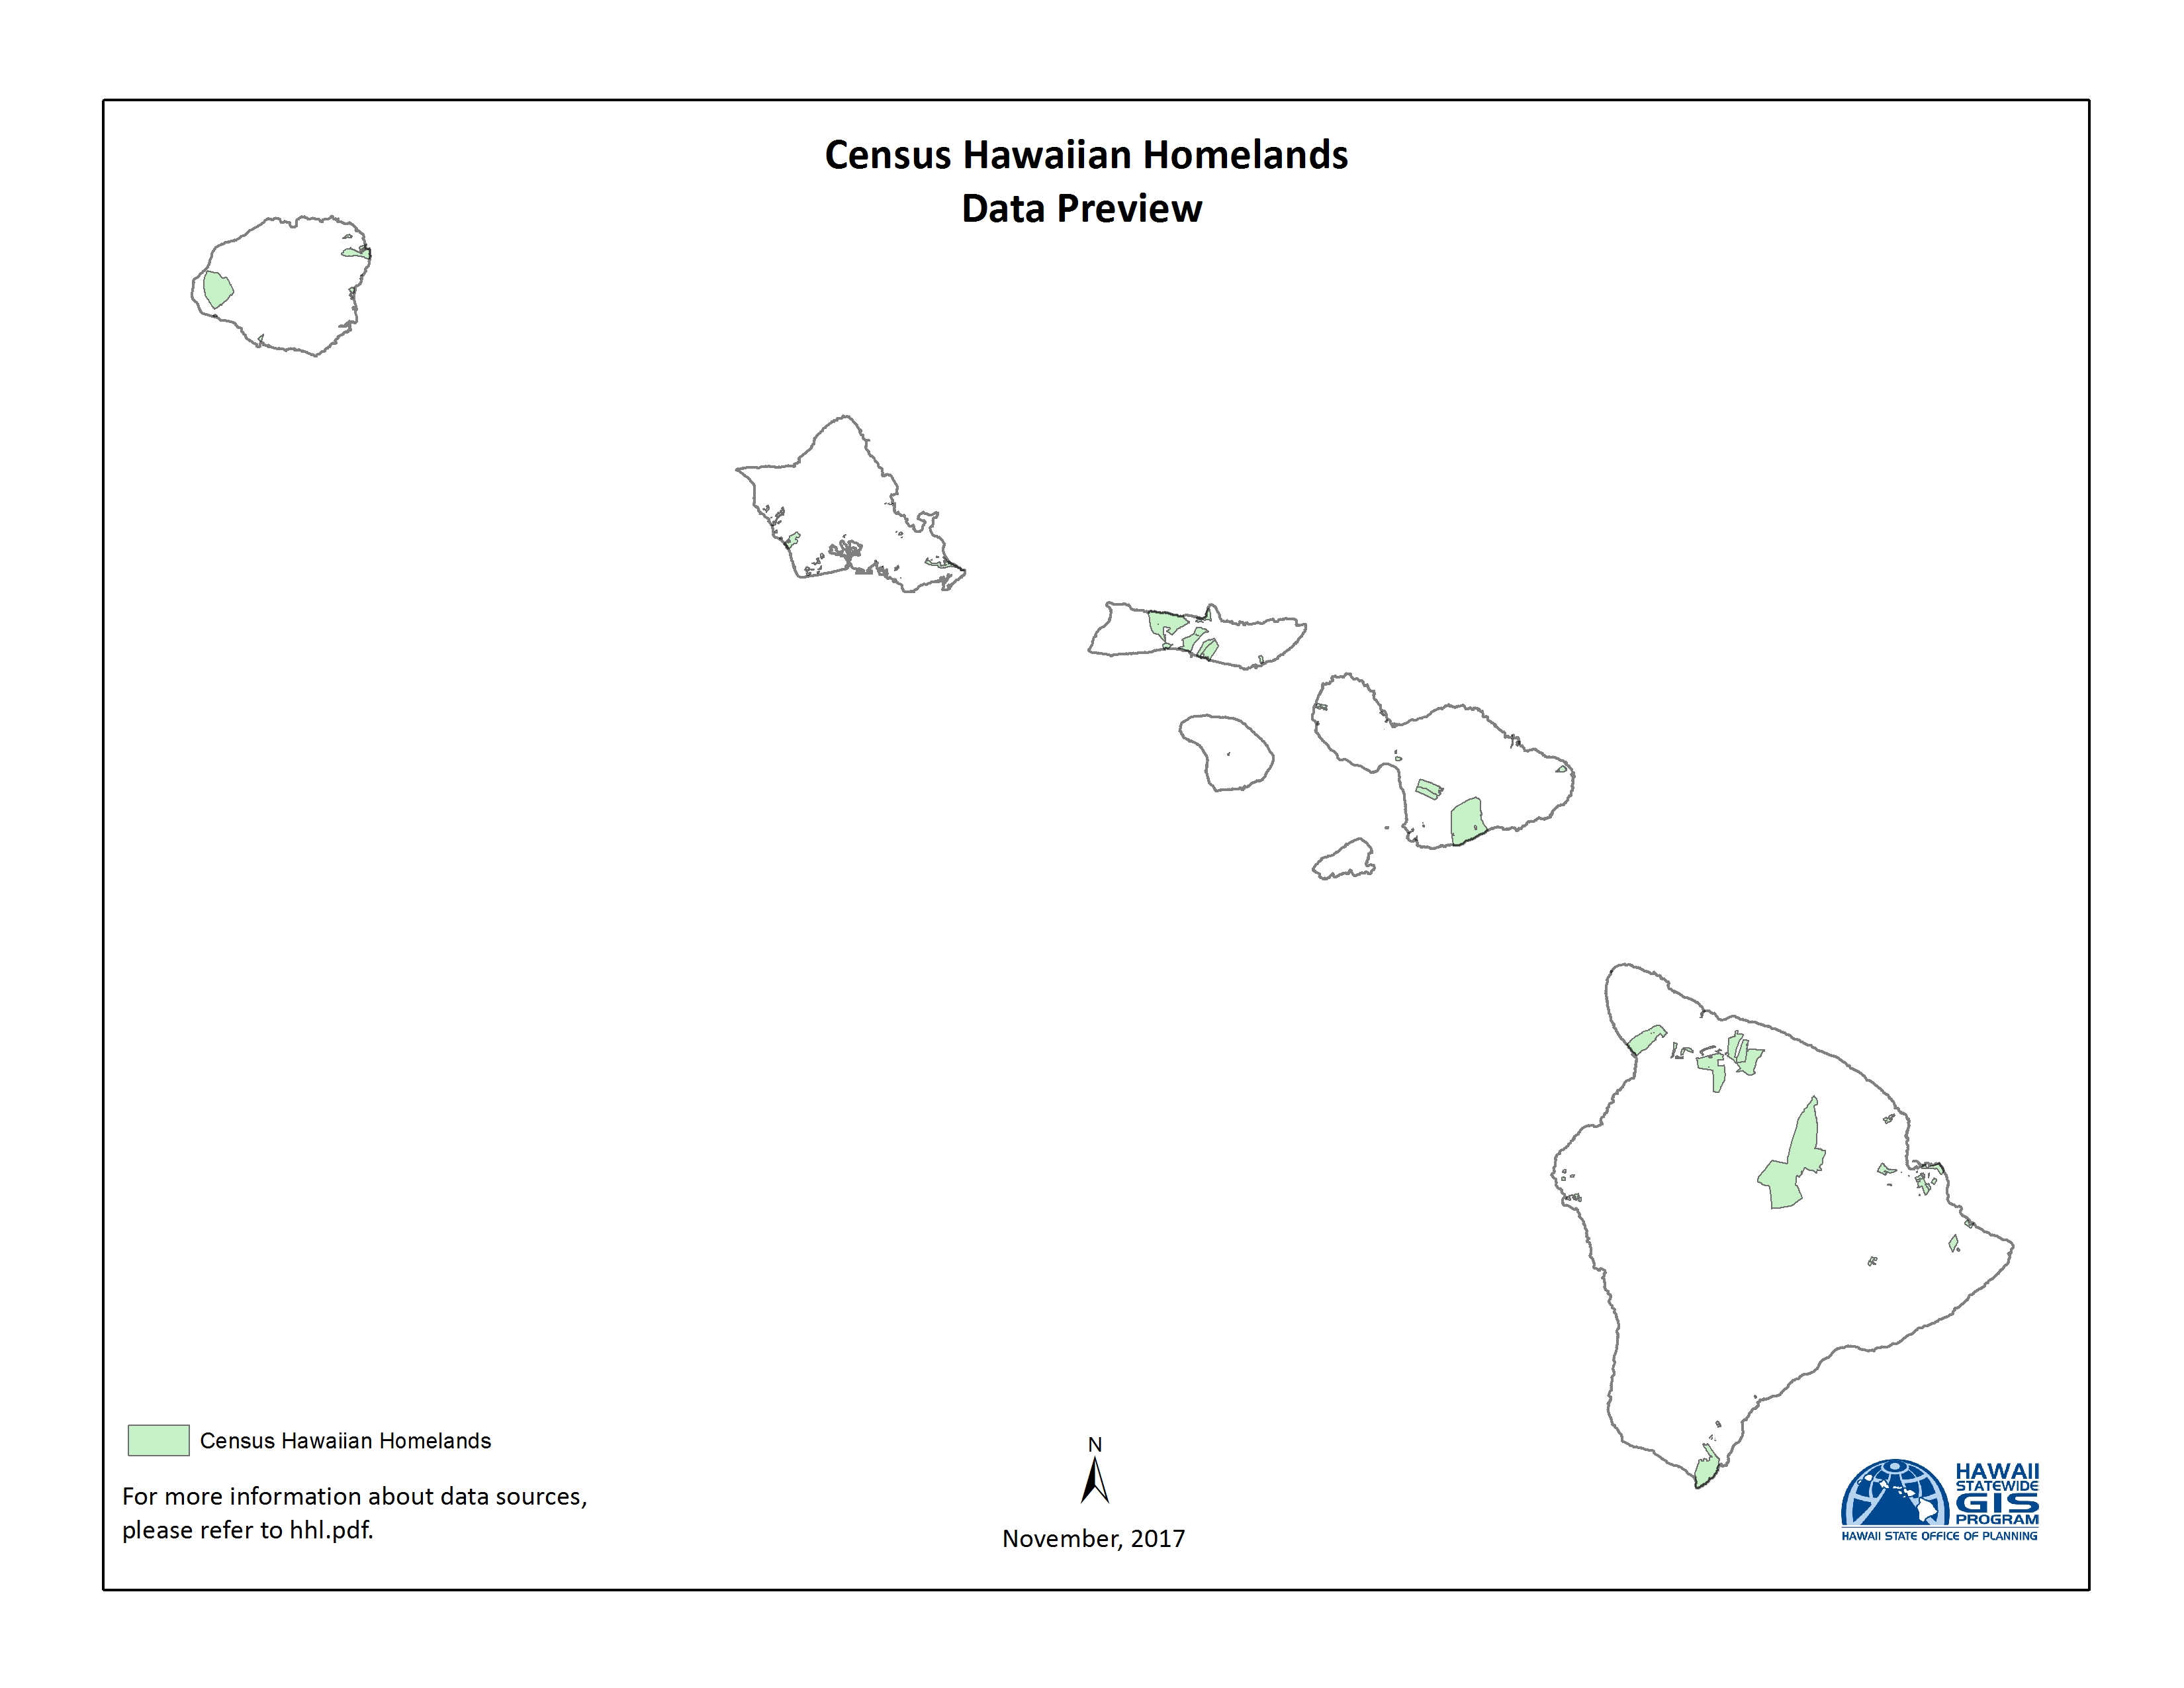
  • Attach population to zip code polygons.
  • Attach income levels to zip code polygons

How do we answer questions?

  • Layer features on top of one another.
  • Calculate overlapping, contains, etc.
  • Calculate distance from other features.

Example: Peet’s Coffee

  • Get Zip code polygon features (US census, NCOne Map, etc.)
  • Get income levels for zip codes (US census)
  • Get population levels for zip codes.
  • Get locations of Starbucks (Open Street Map, Overpy, etc.)
  • Calculate zip code population density.
  • Calculate zip code Starbucks density.
  • Select zip codes with high income levels, high population density, low Starbucks density.

Example as a group.

Where to get Geospatial Data?

  • NHGIS (National Historical Geographic Information System)
  • Open Data
  • Open Street Map Data
  • Tiger/Line Shapefiles from the Census.gov site